

















Malaysia Air Quality and Singapore’s Haze Season: the September 2026 Readings and the Two Numbers That Matter
Malaysia air quality hit its worst of the year in the September 2026 haze season: Department of Environment readings put the API at Serian, Sarawak between 510 and 520 all day on 4 September, above the 500 emergency threshold. A state of emergency was declared for Serian Division that day. Over the same period Singapore’s official 24-hour PSI peaked at 154 on 15 September, in the Unhealthy band.
For a short-stay visitor, haze is a few days of inconvenience. For anyone weighing a move to Singapore or Malaysia — or already living there — the questions are different: which months does haze arrive, how long does it last, which places are worse and which are better, and what is the air like outside haze season? This guide turns the official data into something you can actually use when deciding where to live.
Key Points
- Who needs to take note: anyone considering a move to Singapore or Malaysia, anyone already there who wants to understand their own area, and families arranging long postings or schooling.
- The seasonal answer: the main haze season runs August to October, during the Southwest Monsoon. Malaysia has a second, local peak from February to April; Singapore does not. Dry years make both worse.
- The geographic answer: in Malaysia, Sarawak is by far the worst hit, the Klang Valley second, and Sabah the least affected. Singapore’s five regions all rise together during a peak — no region works as a refuge.
- The counter-intuitive finding: the Peninsular east coast records few Unhealthy days, but Kelantan’s two stations have among the highest annual PM2.5 in the country — little haze does not mean clean air.
Two Indices: PSI in Singapore, API in Malaysia
Both countries use the same family of index, derived from the US EPA’s PSI. Each converts six pollutants into sub-indices and takes the highest one as the reading. During haze season, particulates dominate almost every time.
The table below is drawn from the National Environment Agency’s published PSI guidance and from pages 2, 4, 8 and 12 of Malaysia’s Department of Environment API Calculation document (September 2021 edition):
| Item | Singapore PSI | Malaysia API |
|---|---|---|
| Publishing agency | National Environment Agency (NEA) | Department of Environment (DOE / Jabatan Alam Sekitar) |
| Pollutants | Six (PM2.5, PM10, SO₂, NO₂, CO, O₃) | Six (same; PM2.5 added in 2017) |
| Reported by | Five regions: north, south, east, west, central | Individual monitoring stations by place name |
| Main averaging period | 24-hour PSI, plus a separately published 1-hour PM2.5 | Each pollutant on its own averaging period, highest sub-index taken |
| Band cut-offs | 0–50 / 51–100 / 101–200 / 201–300 / >300 | Identical |
| Extra band | None | One more: “>500 Emergency (Kecemasan)” |
The cut-offs match, but the labels and the tone do not: Singapore calls 101–200 simply “Unhealthy”, while Malaysia’s official bilingual table reads “Tidak sihat (untuk kumpulan yang sensitif) / Unhealthy (for sensitive group)”, flagging that it is aimed mainly at sensitive groups.
One more thing matters when comparing the two countries’ figures. Singapore publishes five regional numbers; Malaysia publishes dozens of place-name numbers. For the same body of smoke, Malaysia’s national maximum will naturally look more extreme than Singapore’s worst region, so the two sets of numbers should not be compared head to head.
Where to Check Malaysia Air Quality and Singapore’s PSI Officially
These entry points follow the footer guidance in NEA’s How to Plan Your Outdoor Activities During Haze and Malaysia’s DOE MyEQMS / APIMS site:
| Country | Website | App |
|---|---|---|
| Singapore | haze.gov.sg (24-hour PSI and 1-hour PM2.5, updated hourly) | myENV |
| Malaysia | eqms.doe.gov.my/APIMS (the old apims.doe.gov.my redirects here) | This article could not verify an official app name on the DOE site; use the website |
Which Months? Singapore Has One Peak, Malaysia Has Two
The Main Peak: August to October
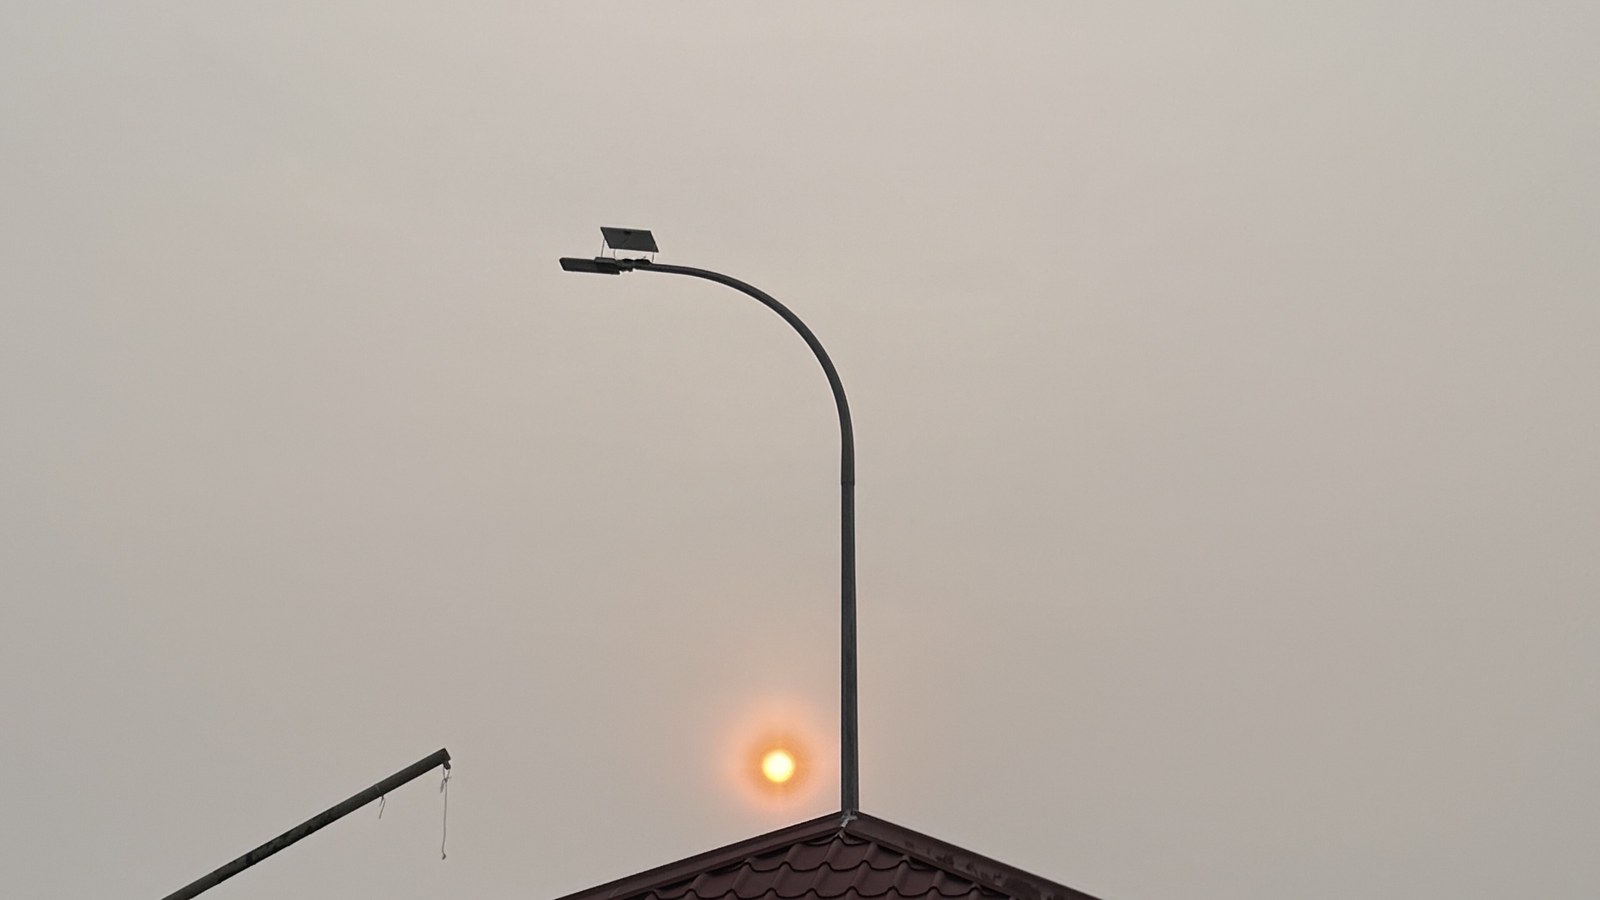
NEA puts it plainly: transboundary smoke haze affects Singapore’s air quality particularly during the Southwest Monsoon period from August to October. During those months the southern ASEAN region is in its dry season and the prevailing low-level winds blow mainly from the southeast or southwest — carrying smoke from southern Sumatra and Kalimantan towards Singapore and the southern Malay Peninsula.
ASMC notes that around early October the Southwest Monsoon gives way to the inter-monsoon period and rainfall increases, which usually brings relief from hotspots and haze.
Why does the smoke linger? A large part of it burns on carbon-rich peatland — once alight, peat smoulders underground, can reignite after the surface fire is out, and keeps emitting for weeks or months.
Malaysia’s Second Peak: February to April (Singapore Doesn’t Have One)
This section needs one distinction made clearly first: Malaysia has two haze periods; Singapore has one.
Malaysia’s second peak comes from local peat and forest fires, not from Indonesian transboundary smoke — DOE’s own haze chronology records the February–March 2014 episode as local peat and forest fires in Selangor, Perak, Pahang, Johor, Kedah, Kelantan and Terengganu. On the Singapore side, this article found no statement from NEA or the Meteorological Service that Singapore has a second haze season; the verifiable official framing is a single season.
ASMC’s March 2026 review supports the Malaysian pattern: hotspot counts across the southern ASEAN region that month were the highest in five years, spread across Kalimantan, the Malay Peninsula and Sumatra, with smoke plumes observed on 12 March (Sumatra), 16 March (the Peninsula), 25 March (Borneo) and 30 March (the Peninsula). The Northeast Monsoon was blowing at the time, mainly from the northeast to east.
Malaysia’s national monthly PM2.5 average matches the shape: on a five-year mean for 2018 to 2022 calculated from official monthly figures, March (about 16.1 µg/m³) is the first-half peak, with August (about 19.6) and September (about 21.4) the highest of the year, and November and December the lowest (about 11.4 and 11.1).
Note that no official source summarises this as “Malaysia has two haze seasons” — the conclusion is assembled from DOE’s chronology, the Meteorological Department’s director-general, Singapore’s Meteorological Service records and ASMC’s monthly reviews. The evidence is solid, but it is a synthesis. Separately, the January–April burning season in northern Thailand, Myanmar and Laos is a different phenomenon and does not directly affect Singapore or Malaysia.
Dry Years Make It Markedly Worse
ASMC’s outlook for September to November 2026 forecast strong El Niño conditions, with below-normal rainfall across most of the Maritime Continent. Under those conditions, hotspot and haze activity can remain elevated and the risk of transboundary haze increases.
That is why years differ so much. Malaysia’s national monthly PM2.5 reached about 52.9 µg/m³ in September 2019, against about 11.5 µg/m³ in the same month of 2020.
Seasonal periods and wind directions below follow the Meteorological Service Singapore’s Climate of Singapore; the haze column also draws on ASMC’s seasonal outlook:
| Season | Months | Wind direction | What it means for haze |
|---|---|---|---|
| Northeast Monsoon | December – early March | Northerly to northeasterly | Smoke from central Sumatra or Johor can still reach both countries |
| Inter-monsoon | Late March – May | Light and variable | Weak winds, poor dispersion |
| Southwest Monsoon | June – September | Southeasterly to southerly | The main haze season, carrying smoke from southern Sumatra and southern Kalimantan |
| Inter-monsoon | October – November | Light and variable, usually wetter | Rain increases and haze usually eases |
Which Places Are Worse? A Region-by-Region Breakdown
Malaysia: Sarawak Is the Worst, by a Wide Margin
In the 2026 season, every reading in the Hazardous band (>300) occurred in Sarawak. All readings below are DOE APIMS data, reported by the outlets named at each point in time:
| Date and time | Places reaching Hazardous, with readings | Reported by |
|---|---|---|
| 2026-08-31 09:00 | IPD Serian 475, Samarahan 334, Sri Aman 330, Kuching 324 | BERNAMA |
| 2026-09-01 16:00 | Serian 381, Kuching 357, Sarikei 345, Sibu 327, Samarahan 326, Sri Aman 312 | RTM |
| 2026-09-04 all day | Serian 510–520, peaking around 521 at 2pm — the season’s highest | RTM, FMT |
Sarawak place names that recurred include Serian, Sri Aman, Kuching, Samarahan, Sibu, Sarikei, Bintulu, Mukah, Kapit, Miri and Limbang. As of 23 September, all 13 areas above the threshold nationwide were still in Sarawak.
The scale of the disruption is worth remembering: the Yang di-Pertuan Agong declared a state of emergency for Serian Division on 4 September, lifted on 7 September once readings fell; and 647 schools across 12 Sarawak districts, covering 198,559 students, closed from 7 to 11 September, switching to home-based learning. Note also that Malaysia’s peak this season fell between 8 August and 4 September, roughly two weeks before Singapore’s worst readings in mid-September — the two countries’ peaks do not necessarily coincide.
The Klang Valley and Selangor are the Peninsula’s most frequent entries, with Johan Setia (Klang) the standout single station: 196 on the morning of 18 September, close to Malaysia’s 200 school-closure threshold. Cheras and Batu Muda in Kuala Lumpur, and Putrajaya, all reached 170 to 174 on 16 September. Perak tops the national table when the Peninsula’s winds shift (Tasek, Ipoh at 188 on 17 September was the national high), and stations in Johor such as Larkin and Pasir Gudang entered the Unhealthy band repeatedly in the second half of September.
Sabah is affected but clearly less so. In early September 2026 its highest reading was Kota Kinabalu Polytechnic at 185, with Kimanis at 170 and Kota Kinabalu at 157 — while Sarawak had stations above 300 at the same time.
But “Few Unhealthy Days” Does Not Mean “Clean Air”
This is the point most worth flagging. Judged on Unhealthy days during haze season, the Peninsular east coast looks good. Judged on annual average PM2.5, the conclusion reverses.
The figures below are the station-level annual PM2.5 published in Table 1.19 of the Department of Statistics Malaysia’s Environment Statistics (States) 2025, for 2024, in µg/m³. That report was released on 31 December 2025 and covers 2020 to 2024:
| Station | State | 2024 annual PM2.5 |
|---|---|---|
| Kapit | Sarawak | 6.65 |
| Sri Aman | Sarawak | 7.68 |
| Sarikei | Sarawak | 8.20 |
| Limbang | Sarawak | 8.31 |
| Mukah | Sarawak | 8.54 |
| Sibu | Sarawak | 9.14 |
| ILP Miri | Sarawak | 9.17 |
| Sandakan | Sabah | 9.42 |
| Samarahan | Sarawak | 9.84 |
| Kuching | Sarawak | 10.16 |
| Keningau | Sabah | 10.34 |
| Kimanis | Sabah | 10.64 |
| Kota Kinabalu | Sabah | 10.84 |
| Miri | Sarawak | 10.89 |
| Tawau | Sabah | 12.51 |
| Bintulu | Sarawak | 12.75 |
| Kuala Terengganu | Terengganu | 15.82 |
| Kota Bharu | Kelantan | 17.11 |
| Tanah Merah | Kelantan | 17.32 |
| Shah Alam | Selangor | 19.10 |
| Petaling Jaya | Selangor | 19.28 |
| Klang | Selangor | 22.57 |
| Banting | Selangor | 29.21 |
In other words: Kelantan’s two stations record higher annual PM2.5 than any station in Sarawak or Sabah, even though Kelantan almost never has an Unhealthy haze day. The genuinely clean spots on the east coast are the smaller stations — Paka and Besut in Terengganu, and Jerantut in Pahang, which was the only Pahang station never to record a single Unhealthy day between 2020 and 2024.
The reverse also holds: the Klang Valley has among the highest annual PM2.5 in the country (Banting 29.21, Klang 22.57), and that is long-run traffic and industrial emissions, not haze season.
DOSM’s own summary of 2024: of 65 stations nationwide, those recording Unhealthy air quality were Bukit Rambai in Melaka (35 days), Tanjung Malim in Perak (22 days), and Rompin in Pahang and Kimanis in Sabah (18 days each).
Sabah: the One Place That Combines Low Annual PM2.5 With Low Episode Risk
Put the two measures together and the picture is clear. Sarawak’s inland stations have very low annual PM2.5, but pay for it with severe transboundary haze episodes. The Klang Valley runs high year-round. The east coast has few episodes but unremarkable annual figures. Sabah — Sandakan, Keningau, Kota Kinabalu, Kimanis — is the one place that combines low annual PM2.5 with relatively low episode risk.
Singapore: Regional Differences Exist, But There Is No Refuge
NEA publishes the 24-hour PSI for five regions — north, south, east, west and central — with the national reading taken as the highest of the five. During the September 2026 haze, central read highest throughout. The figures below come from the NEA real-time PSI API on data.gov.sg, taking each region’s daily maximum 24-hour PSI:
| Date | central | east | west | south | north |
|---|---|---|---|---|---|
| 2026-09-14 | 141 | 121 | 117 | 106 | 97 |
| 2026-09-15 | 154 | 128 | 128 | 111 | 104 |
| 2026-09-20 | 123 | 102 | 106 | 89 | 85 |
On peak days the spread between the highest and lowest region was roughly 44 to 57 points — enough to put one region in Unhealthy while another sits near the boundary, but all five were above 97 on 14 and 15 September. The difference is of degree, not of kind. Outside haze episodes the spread is smaller still: on the evening of 23 September the five regions read 59 to 70, a gap of 11 points.
At the scale of a city-state, choosing a district makes little difference to haze exposure.
What the Air Is Like Outside Haze Season
Haze is seasonal; air quality is a year-round matter.
Sources. NEA states that the main sources of air pollution in Singapore are emissions from industry and motor vehicles. Malaysia’s DOE lists more: industry, development activities, motor vehicles, power generation, land clearing, and open burning and forest fires.
Singapore’s annual PM2.5 (NEA’s official dataset) peaked at 24 µg/m³ in the major haze year of 2015, improved steadily, and has held at 11 to 12 µg/m³ since 2020, reading 12 in 2025. Singapore’s own 2020 target was an annual average of 12 µg/m³, which NEA states has been met.
Malaysia’s own ambient standard (2020 stage) is 15 µg/m³ annual and 35 µg/m³ over 24 hours for PM2.5. Calculated from official monthly figures, the national annual average ran about 12.3 to 12.9 µg/m³ from 2020 to 2022 — below the domestic standard — but about 20.5 in the major haze year of 2019, above it.
Against the WHO benchmark. The World Health Organization’s 2021 global air quality guideline for annual PM2.5 is 5 µg/m³, with four interim targets at 35, 25, 15 and 10. On that basis Singapore’s 12 µg/m³ in 2025 is about 2.4 times the guideline — already better than interim target 3 (15) and close to interim target 4 (10) — and Malaysia’s national figure of around 12.3 is comparable. Everyday air in both countries is far worse than the WHO guideline, but not bad by Asian city standards.
One caveat: NEA’s page gives the “WHO ultimate guideline” for PM2.5 as 10 µg/m³, which is the 2005 figure; WHO tightened it to 5 in 2021.
What to Do: Official Guidance and Practical Steps
Which Number to Read
PSI and API are both averages, so a sudden thickening of smoke will not show up immediately. For conditions right now in Singapore, read the 1-hour PM2.5 figure. Malaysia’s API has no equivalent 1-hour PM2.5 tool.
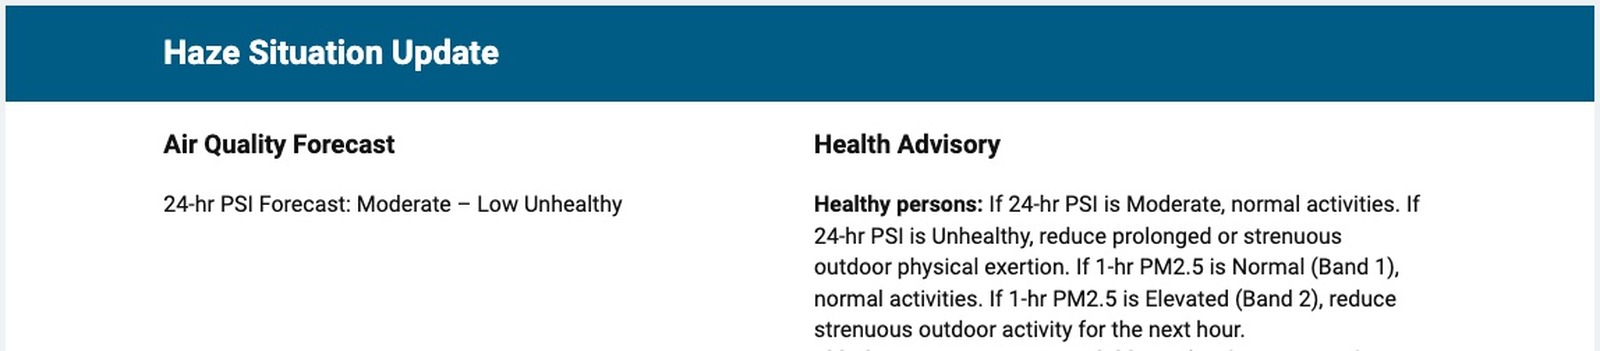
The 1-hour PM2.5 personal guide below follows NEA’s How to Plan Your Outdoor Activities During Haze (July 2024 edition) verbatim:
| Band | 1-hour PM2.5 | Advice |
|---|---|---|
| Band 1 (Normal) | 0–55 µg/m³ | Continue with normal activities |
| Band 2 (Elevated) | 56–150 µg/m³ | Reduce strenuous outdoor activity for the next hour; vulnerable persons avoid it |
| Band 3 (High) | 151–250 µg/m³ | Avoid strenuous outdoor activity for the next hour; vulnerable persons avoid all outdoor activity |
| Band 4 (Very High) | ≥251 µg/m³ | Minimise all outdoor activity for the next hour; vulnerable persons avoid all outdoor activity |
NEA defines vulnerable persons as the elderly, pregnant women, children, and people with chronic lung or heart disease.
Masks
Singapore’s Ministry of Health is explicit: ordinary surgical masks are not effective against haze, because they do not filter particles 2.5 microns or smaller; a surgical mask is designed to protect the environment from the wearer, not the wearer from the air.
The threshold for an N95 is higher than most people assume: a healthy person is advised to wear a well-fitted N95 only if they need to be outdoors for several hours and air quality is forecast to be hazardous (PSI above 300). NEA’s September 2026 release reiterated that N95 masks are not required for short exposure such as commuting, and are not needed indoors.
Some people should ask a doctor first: the elderly, pregnant women, and anyone with severe lung or heart disease who already has difficulty breathing at rest or on exertion. An N95 increases breathing resistance, and some people experience discomfort, fatigue or headaches. People with chronic lung or heart disease should avoid outdoor activity when the PSI is above 200.
Indoors
When air quality worsens, close doors and windows, use air conditioning and a portable air purifier, and clean with damp methods such as mopping rather than vacuuming, which stirs particles back into the air. People with chronic conditions should keep medication to hand.
School Closures: Two Completely Different Systems
This is one of the most practical differences between the two countries, and it matters most to families with children.
| Malaysia | Singapore | Basis | |
|---|---|---|---|
| Written numeric threshold | Yes. Schools, kindergartens and childcare centres close immediately once the API reaches 200 | No published numeric threshold | Malaysia: DOE Pelan Tindakan Jerebu Kebangsaan, Alert 3A; Singapore: no threshold in NEA releases |
| How it is applied | The threshold is written, but early dismissal, cancelling afternoon sessions and timing of return are left to principals | Decided case by case by the Ministry of Education, based on health advisories and the next day’s forecast | Malaysia: Appendix 4 of the same plan; Singapore: NEA release, 4 September 2026 |
| School facilities | — | Air purifiers installed in all classrooms in primary and secondary schools, MOE kindergartens and special education schools; national examinations proceed as scheduled | NEA release, 4 September 2026 |
| Other measures | Above API 200, disaster management committees activate at district, state and federal level; above 300, all earthworks suspend | Above PSI 100 the government action plan activates with daily haze advisories; above 200, air-conditioned community centres open as cooling centres | Official documents of both countries |
The widely circulated claims that Singapore closes schools at PSI 200 or 300 could not be verified against Ministry of Education or NEA documents, and should be treated as case-by-case decisions.
Common Misunderstandings: Five Things People Get Wrong Before Moving
One: “Haze comes once a year — you just put up with it for a few days”
Why that is incomplete: the main season is not “a few days” — in 2026 Sarawak had stations above the threshold from late August into late September, including 647 school closures from 7 to 11 September. And if you are living in Malaysia you also have the February-to-April local burning peak to allow for, which Singapore does not have.
Practical note: when assessing a location in Malaysia, count both August–October and February–April; in Singapore only August–October. Dry years run longer.
Two: “The east coast has no haze, so the air is good”
Why that is incomplete: days above the threshold and annual concentration are two different things. Kota Bharu (17.11) and Tanah Merah (17.32) have higher annual PM2.5 than any station in Sarawak or Sabah, yet barely register an Unhealthy haze day.
Practical note: read both numbers — annual PM2.5 for the everyday baseline, threshold days for episode risk.
Three: “The highlands must be cleaner”
Why that is incomplete: there is no DOE air quality monitoring station in Cameron Highlands. The “Cameron Highlands AQI” shown on consumer sites comes from third-party sensors or models, not an official station reading, and this article found no published official annual figure for the highlands. The closest official Peninsular reference is Tanjung Malim in Perak — and it is deteriorating: PM2.5 of 7.52 with zero threshold days in 2020, against 12.63 and 22 threshold days in 2024.
Practical note: cleaner highland air is a reasonable assumption, but there is no official station data to support it — do not treat it as established fact when making a decision.
Four: “A mask will sort it out”
Why that is incomplete: surgical masks do not filter PM2.5, as the health ministry states plainly. N95s work, but the official threshold is “several hours outdoors with hazardous air forecast”, not everyday commuting — and an N95 adds breathing resistance, which some groups should discuss with a doctor first.
Practical note: staying indoors with windows closed and an air purifier running does more than a mask.
Five: “Singapore is one city, so the district makes no difference / makes a huge difference”
Why that is incomplete: both extremes are wrong. On peak days the spread between regions is about 44 to 57 points, which is real; but all five regions rise together and none stays in a safe range. Outside haze episodes the spread is only about 11 points.
Practical note: in Singapore, district choice has limited effect on haze exposure — put the effort into indoor air at home instead.
Worked Examples: Three Situations When Deciding Where to Live
One: Moving to Malaysia with school-age children
Background: a family of four considering a move to Malaysia, with children entering local schools, comparing Kuala Lumpur, Penang and Kota Kinabalu.
The problem: school closures during haze season disrupt lessons and childcare; long-run air quality affects health.
How to handle it: read the two measures separately — the Klang Valley has among the country’s highest annual PM2.5 (Klang 22.57, Banting 29.21), while Kota Kinabalu in Sabah is 10.84 with markedly lighter haze episodes. Malaysia closes schools immediately at API 200, so have a childcare plan ready.
What not to overlook: in a season of 2026’s intensity, no Malaysian state can claim to be unaffected — the difference is in days and peaks.
Two: A three-year posting to Singapore, choosing a rental district
Background: deciding between the east, west or central regions, and whether air quality varies much.
The problem: a worry that some districts are much worse during haze.
How to handle it: the official regional data shows central reading highest during the haze period, but all five regions rise together and none is a refuge; outside episodes the spread is only about 11 points. District choice has limited effect, so commuting and amenities deserve more weight.
What not to overlook: Singapore publishes no numeric school-closure threshold, schools stay open and classrooms have air purifiers, so the uncertainty for families is lower than in Malaysia.
Three: Already living in Sarawak and wondering whether to move
Background: working in Kuching, having been through days of Hazardous readings in the 2026 season.
The problem: is this normal or exceptional?
How to handle it: Kuching’s 2024 annual PM2.5 was 10.16 µg/m³, lower than any Klang Valley station — Sarawak’s problem is not its everyday air but the intensity of seasonal transboundary episodes. ASMC forecast strong El Niño conditions for September to November 2026, making it a heavier year.
What not to overlook: the decision turns on whether you can absorb several weeks of peak conditions each year; if not, Sabah is the alternative that combines a low annual baseline with low episode risk.
FAQ: Malaysia Air Quality and Singapore Haze
When is the haze season in Singapore and Malaysia?
The main haze season is August to October, during the Southwest Monsoon — NEA’s official position, and it applies to both countries. Malaysia has a second peak from February to April that Singapore does not; it comes from local peat and forest fires rather than Indonesian transboundary smoke, and Malaysia’s national monthly PM2.5 average also shows March as the first-half peak. Conditions usually ease from early October, when the inter-monsoon period brings more rain.
Which Malaysian state has the worst Malaysia air quality during haze?
Sarawak, by a wide margin. Every Hazardous reading (API above 300) in the 2026 season occurred in Sarawak, with Serian running 510 to 520 on 4 September. On the Peninsula, Johan Setia in Klang most often tops the national table. Sabah is affected but clearly less so — its highest reading in early September 2026 was about 185, while Sarawak had stations above 300 at the same time.
Where is Malaysia air quality best?
It depends which question you are asking. On annual average PM2.5, the lowest are Sarawak’s inland stations (Kapit 6.65 and Sri Aman 7.68 µg/m³ in 2024) and Sabah’s stations (Sandakan 9.42, Keningau 10.34, Kota Kinabalu 10.84). On episode risk, Sarawak is the worst and Sabah far lower. Sabah satisfies both. Note too that while the Peninsular east coast has few threshold days, Kelantan’s two stations (17.11 and 17.32) are among the highest annual figures in the country.
What is the air quality in Cameron Highlands?
This article found no official data. Malaysia’s Department of Environment has no air quality monitoring station in Cameron Highlands, so there is no official API or PM2.5 station reading; the “Cameron Highlands AQI” shown on IQAir, AccuWeather and similar sites comes from third-party sensors or models. The Meteorological Department operates a Global Atmosphere Watch station at Tanah Rata, but its published monitoring focuses on rainwater chemistry and deposition.
Which part of Singapore has the best air?
The difference is limited. NEA publishes the PSI for five regions, and central read highest throughout the September 2026 haze (154 on 15 September, against 104 in the north the same day) — but all five rise together and none stays in a safe range. Outside haze episodes the spread is only about 11 points. District choice has little effect on exposure.
What kind of mask should I wear during haze?
Ordinary surgical masks are not effective against haze; Singapore’s Ministry of Health states they do not filter particles of 2.5 microns or smaller. A well-fitted N95 works, but the official threshold for using one is a healthy person needing to be outdoors for several hours with hazardous air forecast (PSI above 300). Short commutes and indoor settings do not require an N95. The elderly, pregnant women and people with severe lung or heart disease should consult a doctor before use.
How bad does it have to get before schools close?
The two systems are entirely different. Malaysia has a written threshold: under the National Haze Action Plan, schools, kindergartens and childcare centres close immediately once the API reaches 200, though details such as early dismissal and the timing of return are left to principals. Singapore has no published numeric threshold — schools stay open, all classrooms have air purifiers, national examinations proceed, and closure decisions rest with the Ministry of Education based on health advisories and the next day’s forecast. The circulated claims of a PSI 200 or 300 rule in Singapore could not be verified against official documents.
Where do I check the official readings?
In Singapore, haze.gov.sg (24-hour PSI and 1-hour PM2.5, updated hourly) or NEA’s myENV app. In Malaysia, the Department of Environment’s eqms.doe.gov.my/APIMS (the old apims.doe.gov.my redirects there). Remember that PSI and API are averages — a sudden thickening of smoke will not show immediately, so in Singapore check the 1-hour PM2.5 as well.
By international standards, is everyday air quality in the two countries good or bad?
Against the WHO 2021 guideline for annual PM2.5 of 5 µg/m³, Singapore’s 12 µg/m³ in 2025 is about 2.4 times the guideline, and Malaysia’s national figure of around 12.3 in recent years is comparable. Both are well above the WHO guideline, but already better than WHO interim target 3 (15 µg/m³) and not bad by Asian city standards. Singapore has met its own annual target of 12 µg/m³; Malaysia’s domestic standard is 15 µg/m³.
Still Have Questions? Ask Zagdim
For more on living conditions and relocating to Singapore or Malaysia, Ask Zagdim.
Life abroad? Ask Zagdim.
Your first stop for international property and global living.
Research and insights. Know what’s changing. Understand what matters.
Get overseas change alerts → When a change affects you, we’ll write.
Important Disclaimer
This article is general information and does not constitute health or medical advice. It draws on material published by Singapore’s National Environment Agency, Ministry of Health and Meteorological Service, the data.gov.sg official datasets, Malaysia’s Department of Environment and Department of Statistics, the ASEAN Specialised Meteorological Centre and the World Health Organization. Some daily readings from the 2026 haze season are Department of Environment data as reported by BERNAMA, RTM and others, and are marked as such in the text. Malaysia’s national annual and monthly PM2.5 figures are calculated from official monthly data and are not annual averages published by the Department of Environment. Air quality readings change hour by hour; personal health decisions should follow current official readings and professional medical advice.
Data current as of September 2026; refer to each country’s official announcements for the latest position.
References
National Environment Agency – Air Quality in Singapore / National Environment Agency – How to Plan Your Outdoor Activities During Haze / National Environment Agency – Singapore Government Agencies Implement Measures to Mitigate Impact of Haze / data.gov.sg / National Environment Agency – Pollutant Standards Index (PSI) / data.gov.sg / National Environment Agency – Air Pollutant – Particulate Matter PM2.5 / Ministry of Health Singapore – FAQ: Use of masks and availability of masks / HealthHub, Ministry of Health Singapore – How to Protect Yourself Against the Haze / Meteorological Service Singapore – Climate of Singapore / Department of Environment Malaysia – Air Pollutant Index (API) Calculation / Department of Environment Malaysia – MyEQMS / APIMS / Jabatan Alam Sekitar – Pelan Tindakan Jerebu Kebangsaan / Department of Statistics Malaysia – Environment Statistics (States) 2025 / Department of Statistics Malaysia / OpenDOSM – Monthly Air Pollution / ASEAN Specialised Meteorological Centre – Regional Climate – Seasonal Outlook / ASEAN Specialised Meteorological Centre – Review of Regional Haze Situation for March 2026 / World Health Organization – Ambient (outdoor) air quality and health