

Zagdim International Property Library

Beyond the listing. Understand the property.

One property. One research profile.

  • Traceable sources
  • Priced with a basis
  • Independent insight
Zagdim researcher squirrel holding a magnifier

Global research map

Explore property research around the world.

Zagdim tracks these countries and regions. Gold countries have property research, light blue countries have market data, dark blue countries are being tracked.

Hong KongTaiwanThailandJapanSingaporeMalaysiaPhilippinesVietnamIndonesiaSouth Korea
  • Property research available
  • Market data available
  • Tracked by Zagdim

Country research

Understand market trends before exploring properties.

One section per country: the market snapshot first, then the properties we have researched.

Country

United Kingdom

See all UK research

Region London region

UK HPI, London, January 2023=100

2017202696.4
Past 12 months-3.2%
Past 5 years, cumulative+3.9%

Latest observation: July 2026 · Source

Gross rental yield (estimate) 6.62%Basis: H1 2026 London, 1–3 bedroom median asking rent / asking sale price; Global Property Guide

The index and gross rental yield are market-level data, not the return of any single property.

Show larger chart and index notes
8893981022018202020222024202696.4
Line shows: each July. The vertical axis does not start at zero. Index bases differ by country; points are never compared across countries.

The HM Land Registry index is built from registered sales and valuation data. The latest month is provisional and may be revised. The line shows the July value of each year.

Indicator
UK HPI, London, January 2023=100
Scope
Region: London region
Read on
2026-10-20
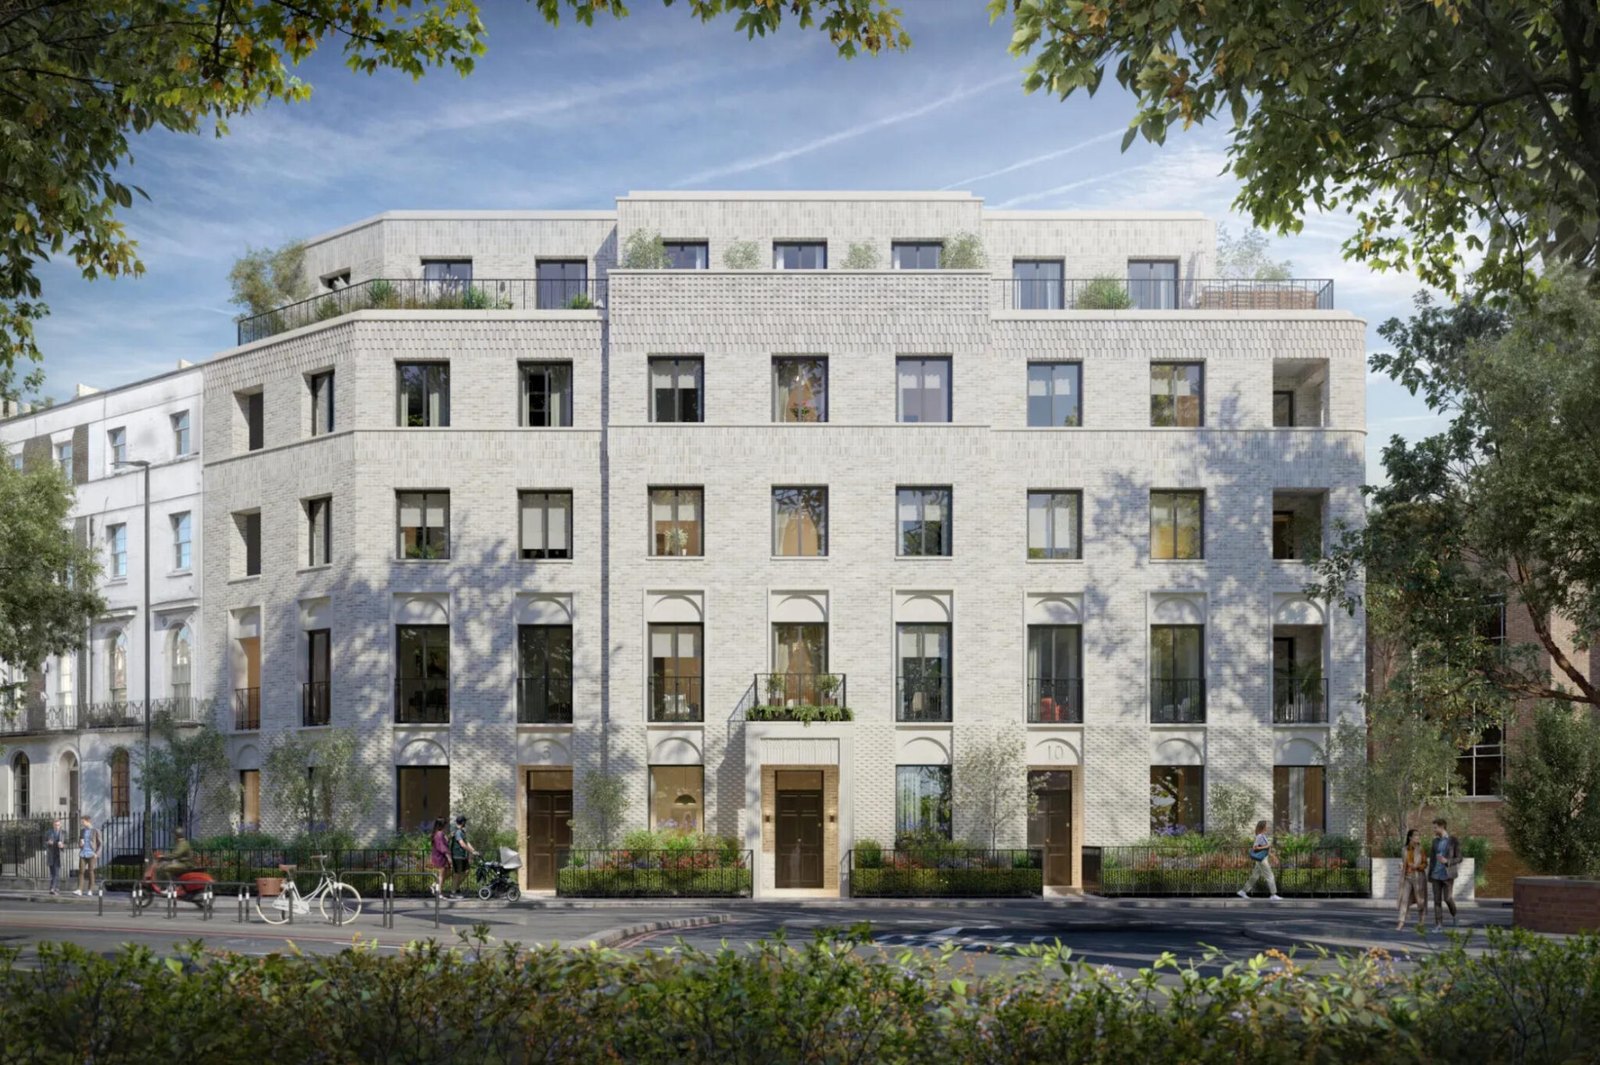
Duke's Row exterior view

United Kingdom · London · Camden

Duke's Row

Developer
Salboy / Forge Homes
Homes
11 homes
Developer starting price£845,000

Research passport

Data checked
2026-10-20
Sources on page
10
Developer check
Official materials provided

Ask before decidingAfter service charges and taxes, how much of the expected rent is left as return?

View property research

Prefecture Tokyo Metropolis

MLIT Residential Property Price Index, Tokyo Metropolis, seasonally adjusted (2010=100)

20162025182.1
Past 12 months+8.0%
Past 5 years, cumulative+38.5%

Latest observation: December 2025 · Source

Gross rental yield (estimate) 2.81% to 5.46%Basis: Q1 2026 Tokyo apartment examples, central 1-bedroom to eastern 23 wards 2-bedroom; Global Property Guide

The index and gross rental yield are market-level data, not the return of any single property.

Show larger chart and index notes
11313916418920172019202120232025182.1
Line shows: each December. The vertical axis does not start at zero. Index bases differ by country; points are never compared across countries.

MLIT builds the index from about 300,000 property transaction price records a year. The official release is delayed, so the latest available period is December 2025. The line shows the December value of each year.

Indicator
MLIT Residential Property Price Index, Tokyo Metropolis, seasonally adjusted (2010=100)
Scope
Prefecture: Tokyo Metropolis
Read on
2026-10-20

Submit a project

No property research page here yet. Developers can apply for one.

Apply for inclusion
Country

Thailand

See all Thailand research

Metro area Bangkok and vicinities

Bank of Thailand residential property price index, Bangkok and vicinities, Condominium (2011=100)

20112026204.4
Past 12 months+4.5%
Past 5 years, cumulative+12.3%

Latest observation: August 2026 · Source

Gross rental yield (estimate) 5.60%Basis: Q3 2026 Bangkok apartment sample gross asking yield; Global Property Guide

The index and gross rental yield are market-level data, not the return of any single property.

Show larger chart and index notes
8613017321720122014201620182020202220242026204.4
Line shows: each August. The vertical axis does not start at zero. Index bases differ by country; points are never compared across countries.

The index is calculated from mortgage-loan data reported by commercial banks and the Government Housing Bank. This is the condominium series for Bangkok and vicinities, not Bangkok city alone. The line shows the August value of each year.

Indicator
Bank of Thailand residential property price index, Bangkok and vicinities, Condominium (2011=100)
Scope
Metro area: Bangkok and vicinities
Read on
2026-10-20
STILL Sukhumvit 20 exterior view

Thailand · Bangkok · Khlong Toei

STILL Sukhumvit 20

Developer
SC Asset / Tokyo Tatemono
Homes
124 homes
Developer starting priceTHB 45 million

Research passport

Data checked
2026-10-20
Sources on page
7
Developer check
Official materials obtained

Ask before decidingHow can buyers verify the payment schedule, foreign ownership quota and costs due at handover?

View property research

Numbers and rules

What the numbers and the rules really mean.

Three ideas that change how you read any price, return or ownership rule.

1Asking price vs sold priceAn asking price is the seller's opening figure. A sold price is what was actually agreed. The two often differ.Open

Where each market shows sold prices

  • United Kingdom HM Land Registry publishes registered sold prices; asking prices differ from completed prices, and recent HPI estimates are provisional. Source
  • Japan MLIT compiles its index from transaction-price data and publishes transaction information; compare asking prices with comparable deals, condition and fees. Source
  • Thailand BOT index uses mortgage-loan data, not a project-level sold-price register; verify transfer prices and costs against listings. Source
  • Malaysia NAPIC indexes and averages are market statistics, not a unit sold price; the Johor state index is not a Johor Bahru city index. Source
  • United Arab Emirates DLD publishes transaction amounts and rent records; do not directly compare listing, off-plan and completed resale prices. Source
  • Vietnam Ministry reports selected apartment market averages, not a transaction-level sold-price register; compare asking prices with completed deals and payment terms. Source
2Gross vs net returnGross yield divides rent by price. Net return is what remains after fees, taxes, vacancy and repairs.Open

How to convert

Gross yield = annual rent ÷ price. Net return = (annual rent − service charges and repairs − taxes − vacancy loss) ÷ (price + purchase costs). The figure is an illustration, not data from any project.

3What foreign buyers can ownIt depends on the country, the type of property and the form of title, not a simple yes or no.Open

Rules in the six markets

  • United Kingdom Non-UK residents can buy freehold or leasehold homes in England; the non-resident SDLT surcharge may apply. Source
  • Japan Official records show land acquisition by foreign persons and entities; reporting obligations can apply to particular land transactions. Source
  • Thailand Foreigners may own condominium units subject to conditions and a 49% foreign-owned floor-area cap per condominium; land rules differ. Source
  • Malaysia A non-citizen or foreign company needs prior State Authority approval to acquire land; thresholds and restrictions vary by state and property type. Source
  • United Arab Emirates Non-UAE nationals may hold freehold in designated areas, with usufruct or leasehold interests of up to 99 years where permitted. Source
  • Vietnam Eligible foreign individuals may own homes in permitted projects, subject to condominium quotas; the individual term is generally up to 50 years, with one possible extension. Source

These are summaries, not legal advice. Eligibility must be checked for each transaction.

City Kuala Lumpur (Johor state shown separately)

NAPIC MHPI All House Price Index (2010=100), Kuala Lumpur; Q2 provisional

20192026207.8
Past 12 months+2.7%
Past 5 years, cumulative+9.0%

Latest observation: Q2 2026 · Source

Gross rental yield (estimate) 4.89% to 5.35%Basis: H2 2026 1-bedroom apartments: Kuala Lumpur 4.89%, Johor Bahru 5.35%; asking-based Global Property Guide

The index and gross rental yield are market-level data, not the return of any single property.

Show larger chart and index notes
1891962032102020202220242026207.8
Line shows: each Q2. The vertical axis does not start at zero. Index bases differ by country; points are never compared across countries.

NAPIC MHPI All House Price Index (2010=100), Johor state (proxy, not Johor Bahru); Q2 provisional

2162522883242020202220242026313.9
Past 12 months +3.6%; 5 years, cumulative +29.7%. Proxy data: Johor state is not Johor Bahru city.

The NAPIC Malaysian House Price Index; Q2 2026 is provisional. The line shows each year's Q2 value. Johor is the state that contains Johor Bahru, not the city itself, so it is charted separately and never on the Kuala Lumpur chart.

Indicator
NAPIC MHPI All House Price Index (2010=100), Kuala Lumpur; Q2 provisional
Scope
City: Kuala Lumpur (Johor state shown separately)
Read on
2026-10-20

Submit a project

No property research page here yet. Developers can apply for one.

Apply for inclusion
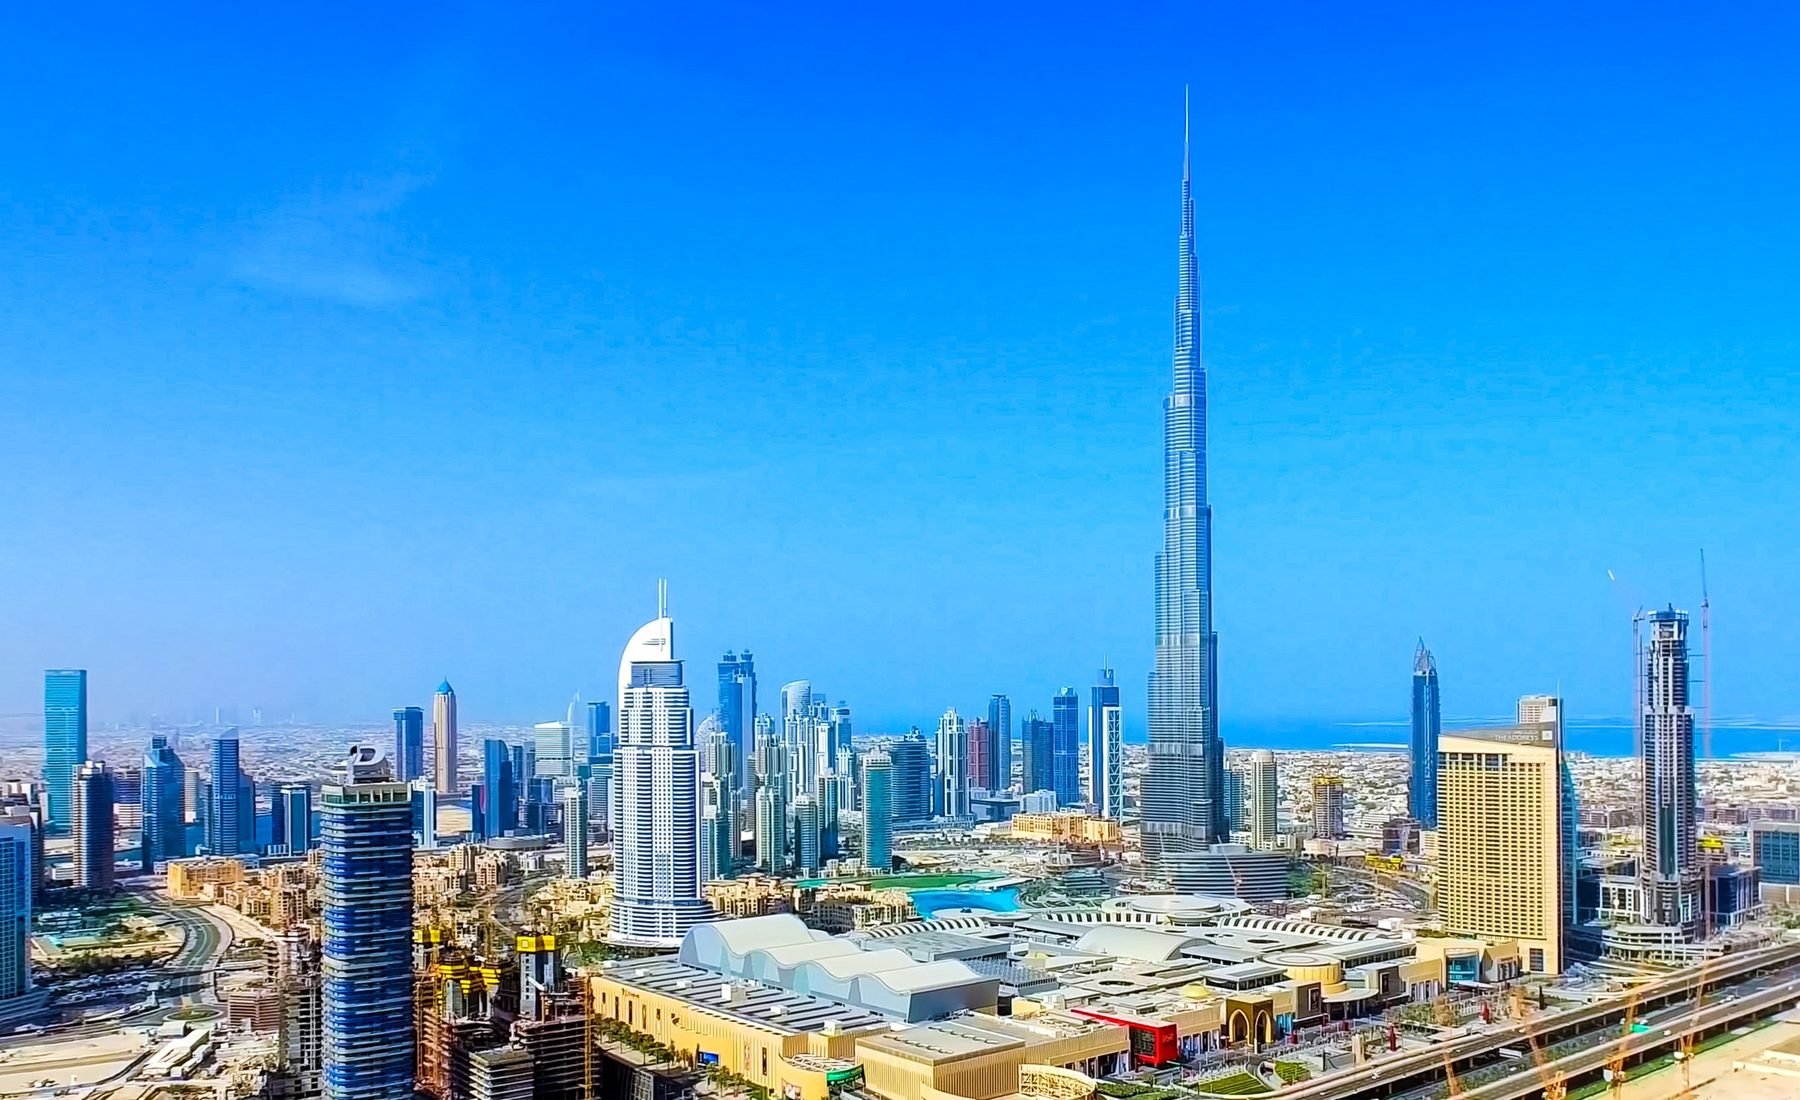
Burj Khalifa and Downtown Dubai skyline under blue sky; UAE property research
Country

United Arab Emirates

See UAE market and rules

Emirate Dubai

Dubai Land Department Residential Sales Price Index (stale; last chart point 2022-11)

No comparable official residential price index yetThe official index chart stops in November 2022 and cannot stand in for current prices.

Source

Gross rental yield (estimate) 5.53%Basis: H1 2026 Dubai, 1–3 bedroom median asking rent / asking sale price; Global Property Guide

The index and gross rental yield are market-level data, not the return of any single property.

Show larger chart and index notes

The Dubai Land Department chart stops at November 2022 and cannot stand in for today's prices. Transaction-level data is public but has not been turned into a comparable index.

Indicator
Dubai Land Department Residential Sales Price Index (stale; last chart point 2022-11)
Scope
Emirate: Dubai
Read on
2026-10-20

Submit a project

No property research page here yet. Developers can apply for one.

Apply for inclusion
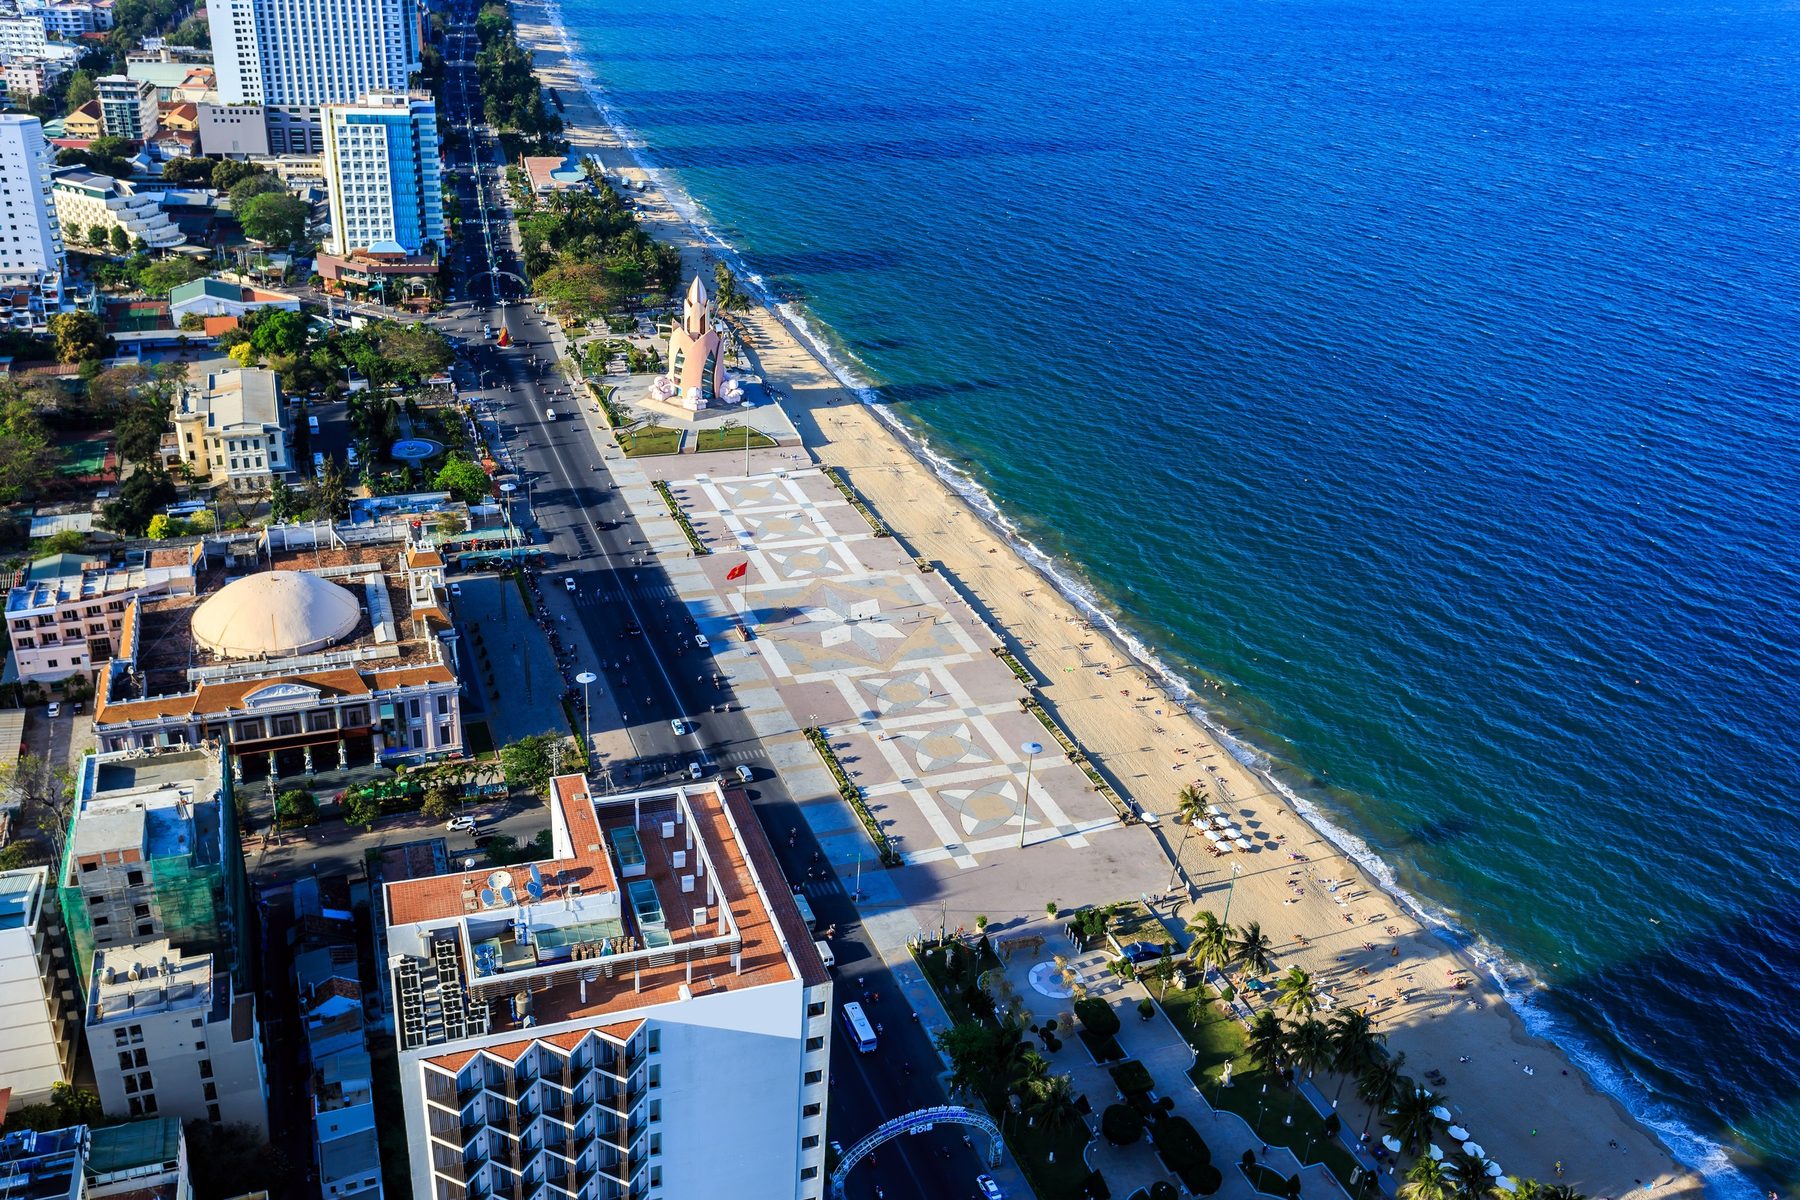
Aerial view of Nha Trang coast and blue sea; Vietnam property research
Country

Vietnam

See all Vietnam research

City Ho Chi Minh City

Ministry of Construction market report; no comparable HCMC transaction-price index verified

No comparable official residential price index yetThe ministry publishes average apartment prices, not a like-for-like index.

Source

Gross rental yield (estimate) 4.16%Basis: H2 2025, Ho Chi Minh City, 1–3 bedroom asking rent / asking sale price; Global Property Guide published table

The index and gross rental yield are market-level data, not the return of any single property.

Show larger chart and index notes

The Ministry of Construction reports average apartment prices and year-on-year moves, not a like-for-like price index. We do not draw a line or substitute an average for an index.

Indicator
Ministry of Construction market report; no comparable HCMC transaction-price index verified
Scope
City: Ho Chi Minh City
Read on
2026-10-20
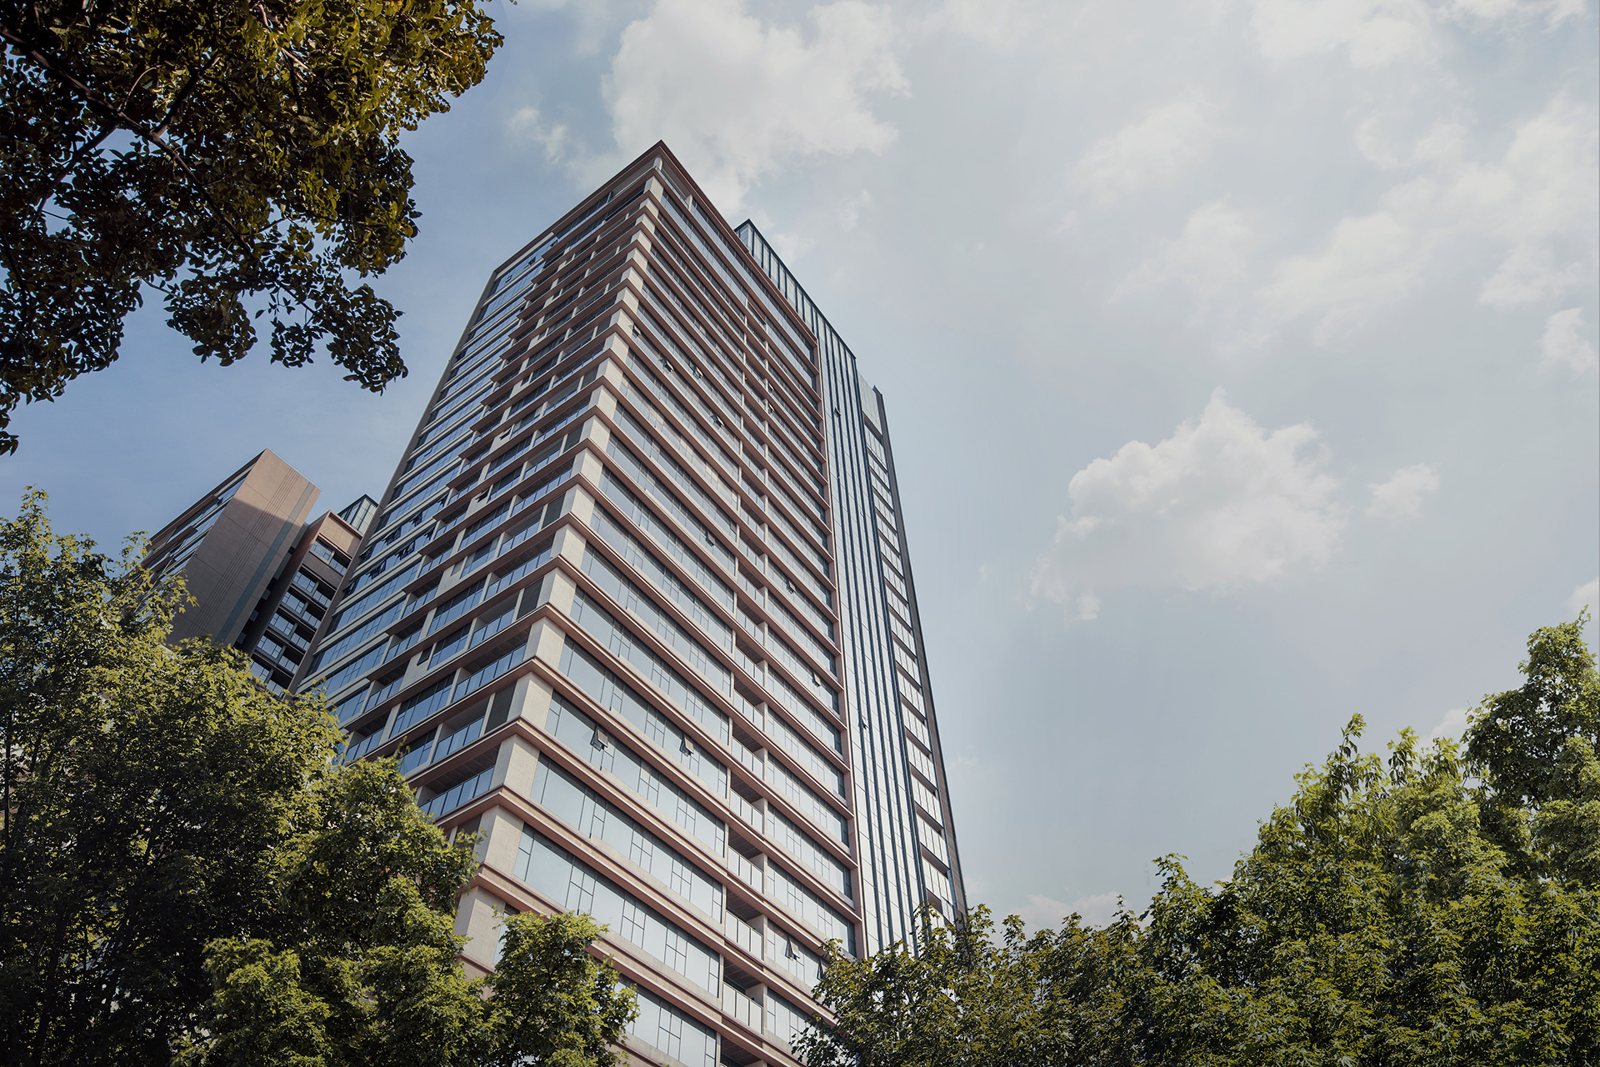
The Marq exterior view

Vietnam · Ho Chi Minh City · District 1

The Marq

Developer
Hongkong Land / Hoa Lam
Homes
515 homes
Resale asking price fromVND 21.5 billion

Research passport

Data checked
2026-10-08
Sources on page
17
Developer check
In progress

Ask before decidingHow far apart are resale asking prices and the developer's remaining-unit prices, and is parking included in the total?

View property research

How we research

What we verify, and how.

Every page follows the same three steps.

1Official and original data

Statistics, registries, laws and developer documents come first.

2Cross-checking

Figures are matched across sources, and each is marked as an asking price, estimate or published fact.

3Zagdim interpretation

What to look at first in this property, and the rules that apply.

Source tiers
  • Tier 1: official statistics, land registries, laws and regulations.
  • Tier 2: developer materials and official announcements.
  • Tier 3: public listings and third-party estimates, always labelled as estimates.
Limits of this library
  • This is not a complete directory of the market.
  • Inclusion is not a recommendation.
  • An asking price is not a transaction price.
  • Indexes with different scopes are not compared with each other.
Corrections

When a material error is found, we verify it, correct the page and note the date of the correction.

Read the full research method

Questions

Common questions

Is this advertising?

No. Zagdim writes and reviews each page independently. Developers can check facts but cannot buy a favourable view, and inclusion is not a recommendation.

Is a reference price the same as the sold price?

No. Prices are asking prices or marked estimates, each with a source and a date. Actual transaction prices can differ.

How does Zagdim choose which properties to research?

We start from the markets and projects readers ask about most, and from whether public information is enough to verify. Developers can apply, but cannot buy inclusion or a favourable view.

Can an agent submit a project?

Yes, with the developer's consent or with materials the developer has authorised. Enquiries come to Zagdim first and are then referred on.

Can I compare returns across countries using these numbers?

No. Each country's index has a different scope, and gross rental yield is a market-level figure, not the return of any single property.

Submit a project

Submit your project

Developers, property managers and agents can all submit.

  • New-build sales
  • Resale
  • Leasing and management

Free to submit and assessed by Zagdim. Content is written independently by Zagdim, and submission does not guarantee inclusion.

Zagdim researcher squirrel holding a checklist

More overseas property questions to clear up?

Ask Zagdim for a clearer starting point.

Ask Zagdim