
































Part One: The Latest Regulatory and Policy Changes Affecting Leverage
As the UK property market recovers, leverage has become a key tool for investors looking to amplify returns. But since 2023, the UK’s Financial Conduct Authority (FCA) has tightened lending conditions, imposing stricter requirements on Loan-to-Value ratios (LTV) and Rental Cover Ratios (RCR). These new rules directly affect how investors allocate capital and manage cash flow, meaning leveraged investing now comes with both greater challenges and new opportunities.
LTV Limits Have Tightened — Breaking the Old Leverage Rules
In the past, investors in the UK property market could generally borrow 75% to 80% of a property’s value, giving them plenty of room to leverage. But since 2023, lending policy has shifted noticeably — particularly in high-value areas such as London, where the maximum LTV has been lowered, putting pressure on investors’ room to manoeuvre.
Within this shift, policy has become clearly divided by region:
- The maximum LTV in high-value areas such as central London has fallen to 65%
- Northern cities such as Manchester and Leeds remain at 75%
- The Mortgage Works (TMW) has explicitly stated that LTV products above 75% apply only to energy-efficient properties rated EPC C or above
This means that to secure a higher LTV, investors need to prioritise more energy-efficient properties, or upgrade a property after purchase to meet energy-efficiency standards.
➡️ Strategic takeaway: Investors who want to maximise their leverage room need to factor energy efficiency (EPC rating) into their property selection, and make sure the property meets the latest lending-approval standards.
Rental Cover Ratio (RCR) Requirements Have Risen — Strengthening the Cash-Flow Safety Net
In the UK property market, the Rental Cover Ratio (RCR) is an important measure of an investor’s cash-flow safety. In the past, stress tests were typically calculated using “product rate + 2%,” but the latest policy has raised the bar further, to make sure investors have enough rental income to cover their loan costs.
The latest changes are:
- The stress-test standard has risen to as high as 7.5%
- The RCR calculation method has changed to a “four-quarter rolling average,” to reduce the impact of seasonal fluctuations
This means that properties with less stable rental income, or a pronounced peak/off-peak seasonal pattern, may not pass lending approval. This change poses a bigger challenge for short-let properties (such as Airbnb), since their cash flow tends to be less stable.
➡️ Strategic takeaway: Choosing properties with stable rental returns and an RCR of 145% or above will be key to leveraged investing. At the same time, optimising a property’s letting structure and increasing the proportion of long-term tenancies can help stabilise cash flow and reduce stress-test risk.
Tax Policy Changes — Squeezing Leveraged Returns
Alongside tighter leverage room, important changes have also taken place in UK tax policy affecting individual landlords and foreign investors. These policy adjustments will further affect investors’ after-tax returns, making “capital allocation” and “tax optimisation” key to how leverage is used.
First, mortgage interest relief for individual landlords has been withdrawn, replaced with a fixed 20% tax credit. This means landlords can no longer deduct mortgage interest in full, so actual holding costs will rise.
In addition, Capital Gains Tax on residential property was 18%/28% (basic/higher rate); from 30 October 2024 it was reduced to a unified 18%/24%, aligning with the general CGT rate rise for other assets, and the “enveloped dwellings” tax exemption has been withdrawn — for investors hoping to profit from short-term price appreciation, this change may squeeze capital returns.
Finally, the tax environment for foreign investors has also become stricter. From 1 April 2025, the standard Stamp Duty nil-rate threshold reverted from £250,000 to £125,000 for all buyers; non-UK-resident buyers separately pay an additional 2% surcharge on top (unchanged, in force since April 2021), meaning foreign buyers will face higher transaction costs.
➡️ Strategic takeaway:
- For heavily taxed individual landlords, setting up a limited company (SPV) to hold property has become a common way to reduce the tax burden
- Through a company structure, mortgage interest can still be deducted in full, and Capital Gains Tax can effectively be reduced to the Corporation Tax rate — currently a tiered structure: 19% on profits up to £50,000, 25% on profits above £250,000 (with Marginal Relief in between), not a flat 19%
- Completing a transaction before the new Stamp Duty policy takes effect helps reduce one-off transaction costs
Practical Recommendations — Leverage Strategy Under the New Regulatory Environment
Under the latest regulatory environment, investors need to reassess their capital allocation and leverage strategy. The following directions are worth considering:
- Prioritise properties rated EPC C or above → Energy-efficient properties not only help with loan approval, but may also qualify for policy incentives
- Keep LTV below 70% → Maintain enough cash-flow headroom to avoid cash-flow risk from market volatility
- Choose properties with a Rental Cover Ratio above 145% → Stable rental income will be key to securing loans and maintaining cash flow
- Use an SPV to optimise tax structure → Effectively reduces holding costs and allows more flexible asset-management options
Part Two: Comparing Leverage and Returns Across Regional Markets
In the UK property market, leverage room and returns vary noticeably between cities. Northern cities (such as Manchester and Leeds) offer higher rental yields and more relaxed lending conditions, attracting large numbers of investors hoping to amplify returns through leverage. By comparison, southern markets such as London and Birmingham have more limited leverage room, but still offer attractive capital-appreciation potential, suiting long-term allocation and steady-growth strategies.
Understanding each market’s leverage characteristics and return potential will be key to improving investment returns.
Leverage and Returns by City
Below is a comparison of maximum leverage, rental yield and five-year price growth across major UK cities:
| City | Average House Price (£) | Max LTV | Rental Yield | 5-Year Growth |
|---|---|---|---|---|
| Manchester | 253,982 | 75% | 6.73% | 27.12% |
| Birmingham | 301,246 | 70% | 4.57% | 21% |
| Leeds | 219,955 | 75% | 9.5% | 30% |
| London | 599,652 | 65% | 4.4% | 11% |
Interest Rate Environment and Leverage Cost Trends
In leveraged investing, interest rates are a key factor affecting both investment returns and cash-flow stability. Over the past few years, the UK’s benchmark interest rate has swung sharply, directly affecting property mortgage rates and leverage costs. As rates have climbed rapidly from historic lows, investors have faced higher borrowing costs and greater cash-flow pressure. However, the market broadly expects the Bank of England to start gradually cutting rates over the next two to three years, which would open up new room and opportunity for leveraged investing.
UK Benchmark Rate and Mortgage Rate Trends
The UK’s benchmark interest rate fell to a historic low of 0.1% in 2020, a period when leveraged investing was highly attractive, letting investors use low-cost borrowing to amplify capital returns. However, to combat inflationary pressure, the Bank of England (BoE) began raising rates consecutively from 2022, and by 2024 the benchmark rate had risen to 4.5%.
Below is the historical trend and forecast for the UK benchmark rate and five-year fixed mortgage rate:
| Year | Benchmark Rate | 5-Year Fixed Mortgage Rate |
|---|---|---|
| 2020 | 0.1% | 1.8%–2.2% |
| 2022 | 3.5% | 4.0%–4.5% |
| 2024 | 4.5% | 4.8%–5.2% |
| 2025 (forecast) | 4.2% | 4.5%–4.9% |
| 2027 (forecast) | 3.0% | 3.8%–4.2% |
How Rate Changes Affect Leveraged Investing
Rate movements don’t just affect the lending rate itself — they are directly tied to an investor’s leverage room and cash-flow pressure.
1. When rates rise → cash-flow pressure increases
- A higher lending rate → higher leverage cost
- For example: if the benchmark rate rises 1%, the five-year mortgage rate could rise to 5.5%–6%
- In a leveraged position, cash-flow pressure and monthly repayment costs will rise noticeably
2. When rates fall → leverage costs come down
- A lower benchmark rate → investors can lower their leverage costs through refinancing
- Rates falling back toward the expected 3%–3.5% range would help improve leverage flexibility
📊 Interest-Rate Sensitivity Analysis
Taking a £500,000 loan as an example, here is how different interest-rate levels affect monthly repayment cost and leveraged investing:
| Mortgage Rate | Monthly Payment (£) | Annual Payment (£) | RCR Requirement (145% standard) |
|---|---|---|---|
| 3% | £2,108 | £25,296 | £3,057/month |
| 4% | £2,387 | £28,644 | £3,461/month |
| 5% | £2,675 | £32,100 | £3,876/month |
| 6% | £2,978 | £35,736 | £4,314/month |
🏦 Fixed vs Variable Rate Strategy
UK mortgage products are generally split into “fixed rate” and “variable rate” — the right choice differs depending on whether rates are rising or falling:
✅ Fixed rate → suited to a rising-rate environment
- Rate-lock periods are typically 2 or 5 years
- Helps control cash flow and reduces the uncertainty that comes with rate volatility
- Current 5-year fixed rates are around 4.8%–5.2%
✅ Variable rate → suited to a falling-rate environment
- The rate tracks market movements
- The market broadly expects rates to fall between 2025 and 2027, so choosing a variable rate may bring lower financing costs
Part Four: Success and Failure Cases in Leveraged Investing
Leveraged investing is a “high-risk, high-return” strategy — whether it succeeds often comes down to how well the leverage ratio is controlled, how stable the cash flow is, and how well the investor responds to market change. In the UK property market, successful leveraged strategies tend to combine “low-cost financing” with “high rental returns” to boost overall investment returns; failed cases are more often the result of over-leveraging, which leads to a funding squeeze or cash flow that can no longer be sustained.
👉 Two successful cases and one failed case below illustrate the common factors behind success and failure in leveraged investing, drawing out practical, real-world strategy lessons.
Success Case 1: The BRRR (Buy, Refurbish, Refinance, Rent) Model
📍 Location: Manchester M14 (student area)
Property type: 3-bedroom terraced house
Leverage method: BRRR (Buy, Refurbish, Refinance, Rent)
The Process:
1. Buy:
- In 2021, the investor bought a 3-bedroom terraced house in central Manchester for £173,000
- Using a 75% LTV leveraged loan, the deposit required was just £43,250
2. Refurbish:
- The investor put in about £15,000 on interior renovation, including a kitchen and bathroom upgrade and double-glazed windows
- This raised the property’s EPC rating from D to B, meeting the lender’s refinancing standard
3. Refinance:
- After renovation, the property’s valuation rose to £245,000
- On the same 75% LTV basis, the investor successfully refinanced £183,750
- After deducting the original loan, the investor recovered £40,500 in cash
4. Let:
- After renovation, monthly rent rose from £850 to £1,200
- Annual rental yield reached 6.7%
- The Rental Cover Ratio (RCR) reached 150%, keeping cash flow stable
Result Analysis:
✅ Capital appreciation: the property gained 41% in value in a short period
✅ High RCR: a 150% rental cover ratio kept cash flow healthy
✅ Refinancing successfully recovered part of the original investment, improving capital flexibility
➡️ Strategy highlights:
- The key to success was “EPC upgrade + choosing the right location”
- Choosing a student area meant stable rental demand and good room for rent growth
- A high rental cover ratio kept cash flow healthy after refinancing
Success Case 2: Low Leverage + Capital Appreciation
📍 Location: London Zone 2 (upscale residential area)
Property type: 2-bedroom flat
Leverage method: Low leverage + long-term holding
The Process:
1. Buy:
- In 2020, the investor bought a 2-bedroom flat in London Zone 2 for £580,000
- Using 60% LTV leverage, the deposit was about £232,000
2. Let:
- Monthly rent was about £2,200
- Rental yield was about 4.5%
- RCR was about 145%, keeping cash flow stable
3. Hold for Appreciation:
- London property prices rose about 18% between 2020 and 2024
- The property’s value rose from £580,000 to £685,000
4. Refinance:
- Refinanced in 2024, with a valuation of £685,000
- Refinanced amount was £410,000, an increase of £58,000 over the original loan
- Successfully recovered part of the capital, creating more funding flexibility for future investment
Result Analysis:
✅ Capital appreciation: 18% growth over four years, a steady return
✅ Healthy cash flow: RCR of 145%, easily covering the mortgage interest
✅ Low-leverage strategy → reduced the risk from market volatility
➡️ Strategy highlights:
- In the London market, capital-appreciation potential is an important safeguard in leveraged investing
- Low leverage reduces market-volatility risk, keeping cash flow stable and the position flexible
Failure Case: High Leverage + a Funding Squeeze
📍 Location: Central London (commercial property)
Property type: Commercial office
Leverage method: High LTV + no cash-flow buffer
The Process:
1. Buy:
- In 2022, the investor bought a commercial property in central London for £800,000
- Using 80% LTV leverage, the loan amount reached £640,000
2. Problems Emerge:
- In 2023, interest rates rose to 5.0%, and the monthly payment rose from £2,600 to £3,500
- As vacancy rose, rent fell from £3,200 to £2,800
- RCR fell to 80%, no longer meeting the lending standard
3. Refinancing Fails, and the Property Is Sold:
- The bank refused to refinance and asked for a larger deposit
- Unable to sustain the cash flow, the investor was forced to sell the property for £750,000
- The final loss exceeded £50,000, including roughly £40,000 of the original investment
Result Analysis:
❌ High leverage → increased interest-rate risk and cash-flow pressure
❌ A market downturn → both price and rent fell, unable to support the mortgage interest
❌ No risk buffer → the funding chain broke, forcing a sale
➡️ Lessons and strategic recommendations:
- Keep LTV below 70% to reduce interest-rate risk
- Prioritise properties with “high rental yield + low vacancy”
- Build a cash reserve of 6–12 months to cope with rate volatility
Part Five: Comparing Leverage Strategy in the UK vs the US vs Singapore
Across the world’s major property markets, leverage has become a core strategy for investors seeking higher returns and capital growth. However, regulatory policy, Loan-to-Value ratios (LTV), rental yields and holding costs differ significantly by country, meaning how well leverage works, and how it should be applied, varies from market to market.
👉 Below is a comparison of the core differences in leverage strategy across the UK, US and Singapore, along with each market’s strengths and weaknesses, to help investors build a more flexible international allocation strategy.
🌍 Market Fundamentals Compared
| Indicator | UK | US | Singapore |
|---|---|---|---|
| Average residential LTV | 75% | 80%–90% | 55%–60% |
| Rental yield | 4.5%–6.7% | 3.8%–5.2% | 2.5%–3.5% |
| Mortgage rate | 4.8%–5.2% (fixed) | 6%–7% (variable) | 3.5%–4.0% (fixed) |
| Loan term | Up to 30 years | Up to 30 years | Up to 35 years |
| Restrictions on foreign participation | No major restrictions | Some states restrict | Additional tax required (ABSD) |
| Capital Gains Tax | 18%–24% | None (except in some states) | None |
| Stamp duty | Up to 15% (for foreigners) | Up to 2% (some states) | Up to 35% (for foreigners) |
| Holding costs | High (property tax, maintenance) | Moderate (varies significantly by state) | High (stamp duty, management fees) |
🇬🇧 UK: Medium-to-High Leverage, Balancing Capital Growth and Cash Flow
Leverage conditions and advantages
✅ Average LTV can reach 75% (up to 80% in some northern markets)
✅ Rental yields as high as 4.5%–6.7%, with stable market demand
✅ Banks offer flexible loan products, including 2-year, 5-year and 10-year fixed rates
Operating model
- Through the “Buy, Refurbish, Refinance” (BRRR) model, capital can be recovered quickly in the short term
- Rental growth in the UK market is stable, making it easier to cover leverage costs through “high leverage + rental return”
Risks and challenges
- Holding costs are relatively high (property tax, maintenance)
- Capital Gains Tax and Stamp Duty may affect short-term returns
👉 Suitable strategy:
🔹 High leverage + short-term returns → suited to northern markets (Manchester, Leeds)
🔹 Low leverage + capital growth → suited to London and other core locations
🇺🇸 US: High Leverage, Low-Tax Environment
Leverage conditions and advantages
✅ Average LTV reaches 80%–90%, offering plenty of leverage room
✅ No Capital Gains Tax (except in some states), attractive for long-term capital allocation
✅ Steady price growth, averaging around 3%–5% a year
Operating model
- US-market leverage strategies commonly run “cash flow + capital growth” side by side
- High leverage is common in both residential and commercial property
- REITs (Real Estate Investment Trusts) are an important tool for high-leverage strategies
Risks and challenges
- Rates are relatively high (currently around 6%–7%), creating greater cash-flow pressure
- Some states have rent control, limiting how much rent can be adjusted
👉 Suitable strategy:
🔹 High leverage + short-term arbitrage → suited to more volatile markets (Florida, Texas)
🔹 Steady leverage + long-term holding → suited to markets like California and New York
🇸🇬 Singapore: Low Leverage, High Holding Costs
Leverage conditions and advantages
✅ Average LTV is only 55%–60%, limited leverage room
✅ Steady price growth, averaging around 2%–3% a year
✅ A stable economy with relatively low market risk
Operating model
- The Singapore market runs mainly on “low leverage + stable returns”
- Foreign buyers must pay an Additional Buyer’s Stamp Duty (ABSD) of 35%
- Property holding tax and management costs are relatively high
Risks and challenges
- High stamp duty and holding costs squeeze capital returns
- Rental yields are relatively low (around 2.5%–3.5%)
👉 Suitable strategy:
🔹 Cash purchase + long-term holding → suited to high-net-worth individuals or institutional investors
🔹 Low leverage + rental return → suited to central-area or luxury properties
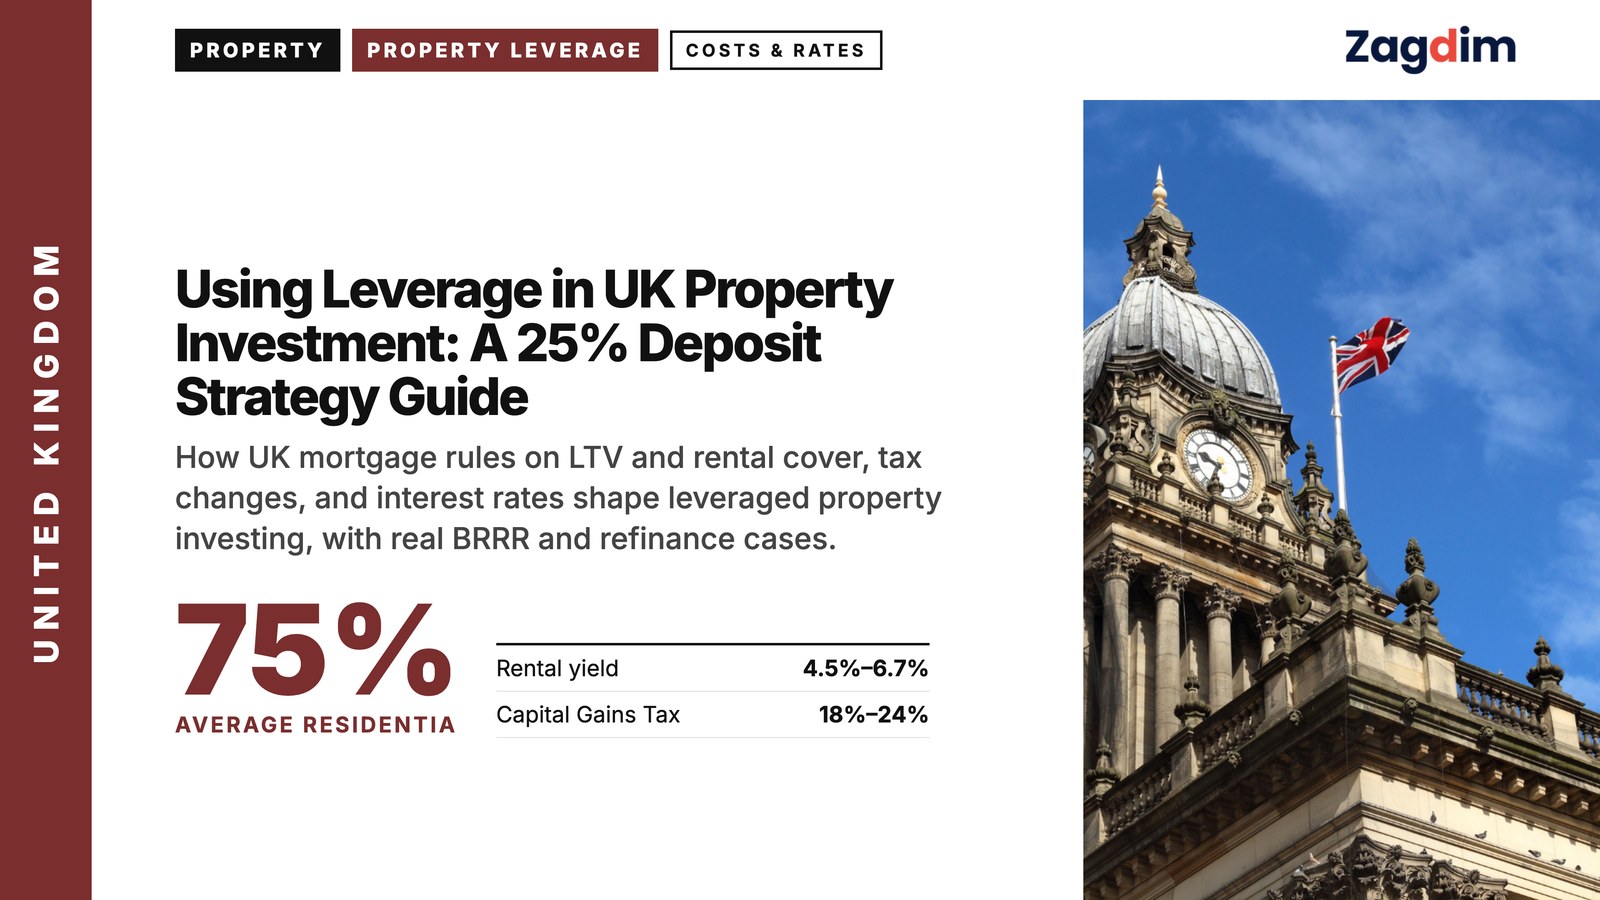
This article takes an in-depth look at UK property leverage strategy, helping investors understand how to use loans (LTV) to amplify investment returns. It compares leverage conditions in the UK, US and Singapore, highlighting the UK market’s advantages in rental yield (up to 6.7%), leverage flexibility (LTV up to 75%) and capital-appreciation potential, and sets out practical strategies such as the “Buy, Refurbish, Refinance” (BRRR) model. For investors looking to improve returns on property investments worldwide, this is a valuable action guide.
*The content above is for reference only, provided as market analysis and strategy discussion, and does not constitute investment advice of any kind. Before making any investment decision, please carry out a full assessment based on your own financial situation, risk tolerance and market conditions, or consult a professional financial adviser.*
Have a question about this guide? Leave a comment below, or ask Zagdim directly.
Your first stop for international property and global living.
Research and insights. Know what’s changing. Understand what matters.